
Introductory audio clip by Laurie Taylor
Competing perspectives of education
Assessing Marxist and functionalist perspectives of education.
Types of schools
Intelligence – nature verses nurture
Tripartite System strengths & weaknesses
Comprehensive Schools strengths & weaknesses
Marketisation and the New Right
Social Policies and Education
Understanding marketisation of education
Social Class and Attainment (factors inside & outside of school)
Social class differences in attainment at school
Factors outside school (please read)
Factors inside school (please read)
Subcultures in Schools:
- male subcultures
- female subcultures
- ethnic minority subcultures
- Willis’ anti-school subcultures
- Criticisms of material, cultural and interactionist explanations
Fee-paying schools
Gender and achievement
Why girls are doing better than boys
Gender and pupil/teacher interaction
Feminisation of academic success
Examination system and gender differences
Socialisation, gender and achievement
Ethnicity and achievement
Policies helping to raise achievement
Ethnicity and attainment – part 1
Ethnicity and attainment – part 2
Globalisation and education
Revision notes
Postmodernism and education
Over the past century the UK birth rate has been in decline and there’s there is plentiful academic debate about the reasons for these low fertility rates and reduction in average family size which are evident in these two papers Delayed Childbearing and Childbearing On Hold. The extent of these changes is evident in the 2013 childbearing data.
The growth in cohabitation as helped remove the stigma of births outside marriage to the extent the number of births outside marriage has increased to around 40% of all births. At the same time women are having fewer children or having them later in life or indeed remaining childless which has increased over the past 70 years.
Beck (1992) suggests this latter change is due to the increasing contradiction between women’s domestic roles and paid employment. But it could also be due to the rising cost of childcare.
Many factors affect childbearing behaviour, and hence fertility levels:
- increased education and economic independence among females
- high and rising aspirations have created a need for a second income

- encouraged women’s participation in the labour force
- both sexes investing more in their careers
- cheaper and readily available contraception
- increased secularisation of society
- society’s attitudes and people are increasingly less constrained by social norms
- rise in the importance attached to the individual and freedom of choice including life and leisure choices
- children are very expensive to raise as their individual needs for clothing, after-school clubs, tuition/school fees
- people have also retreated from permanent commitments and are more cautious about investing their identity in family because of the increased probability of separation and divorce

Follow this link for the data on the demographic differences between countries
In many ways the industrial revolution was a manifestation of this change. The industrial revolution was a time where our modern values were born. Industry and commerce were slowly becoming the driving force of human existence with the growth in science helping us understand how the world around us functioned (now you can get the idea why the inception sociology was born).
The influence of this mechanisation on the Arts is documented below:
- BBC documentary The Romantics – Liberty (part 1)
- BBC documentary The Romantics – Nature (part 2)
- Shelly; Keats; Mary Shelly
3. BBC documentary The Romantics – Liberty (part 3)
BBC documentary on Mary Shelly’s Frankenstein
Return to understanding modernity
The adjacent diagram illustrates the major transmission pathways of faecal-oral diseases. Sanitation breaks transmission by preventing the contamination of ‘fluids’ and ‘fields’ and via removal of breeding grounds for flies. 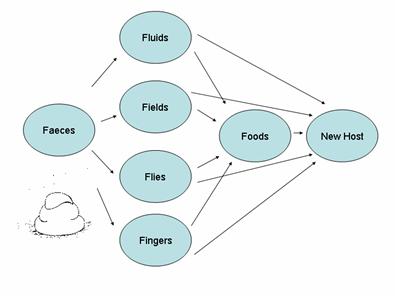
Faecal-oral diseases represent the largest health burden associated with a lack of improved sanitation, diarrhoea being the most burdensome of these and accounting for over 1.6million child deaths each year.
Most evidence exists for the impact of sanitation on diarrhoeal diseases, though there is also evidence for the protective effect against hookworm, roundworm and whipworm, and a growing body of evidence for prevention of trachoma transmission via reductions in fly populations.
- The major soil-transmitted helminths showing association with poor access to improved sanitation are hookworm, roundworm and whipworm, all of which are transmitted when eggs are passed in human faeces which is then left in the environment.
- Beef and pork tapeworms infect humans when infected and inadequately cooked animal meat is eaten. Humans can then contribute to the continued life cycle by defecating in such a manner that the eggs in their faeces are eaten by the original animal hosts.
- Water-based helminths have aquatic intermediate hosts, for example snails, and are responsible for diseases such as schistosomiasis/bilharzias. Humans can become infected through contact with water carrying schistosome larvae and contribute to the transmission cycle when the excreta or urine of infected persons contaminates water bodies containing the aquatic snail hosts.
- Excreta-related insect vectors include mosquitoes, flies and cockroaches which breed in sites contaminated with human faeces. Sanitation-related diseases in this category include trachoma, transmitted in part via Musca sorbens flies which breed in scattered human faeces, and filariasis which is spread via Culex mosquitoes which breed in septic tanks and flooded latrines
Taken from and more details available at http://www.lboro.ac.uk/well/resources/fact-sheets/fact-sheets-htm/Household%20Sanitation.htm
- 1953 James Watson and Francis Crick at Cambridge University describe the structure of the DNA molecule. Maurice Wilkins and Rosalind Franklin at King’s College in London are also studying DNA. (Wilkins in fact shares Franklin’s data with Watson and Crick without her knowledge.) Watson, Crick, and Wilkins share the Nobel Prize for Physiology or Medicine in 1962 (Franklin had died and the Nobel Prize only goes to living recipients)
- 1954 Dr. Joseph E. Murray performs the first kidney transplant between identical twins
- 1955 Jonas Salk develops the first polio
- 1957 Dr. Willem Kolff and Dr. Tetsuzo Akutzu implant the first artificial heart in a dog. The animal survives 90 minutes
- 1962 First oral polio vaccine (as an alternative to the injected vaccine)
- 1964 Firstvaccine for measles
- 1967 First vaccine for mumps
- 1967 South African heart surgeon Dr. Christiaan Barnard performs the first human heart transplant
- 1970 First vaccine for rubella
- 1974 First vaccine for chicken pox
- 1977 First vaccine for pneumonia
- 1978 First test-tube baby is born in the UK
- 1978 First vaccine for meningitis
- 1980 W.H.O. (World Health Organization) announces smallpox is eradicated
- 1981 First vaccine for hepatitis B
- 1982 Dr. William DeVries implants the Jarvik-7 artificial heart into patient Barney Clark. Clark lives 112 days
- 1983 HIV, the virus that causes AIDS, is identified
- 1992 First vaccine for hepatitis A
- 1996 Dolly the sheep becomes the first mammal cloned from an adult cell (dies in 2003)
- 1998 First vaccine for lyme disease
- 2007 Scientists discover how to use human skin cells to create embryonic stem cells
Read more: Medical Advances Timeline | Infoplease.com http://www.infoplease.com/ipa/A0932661.html#ixzz2Y4FjZtKJ
According to the Office for National Statistics the 2011 Census revealed just under a third of households consisted of one person in 2011; 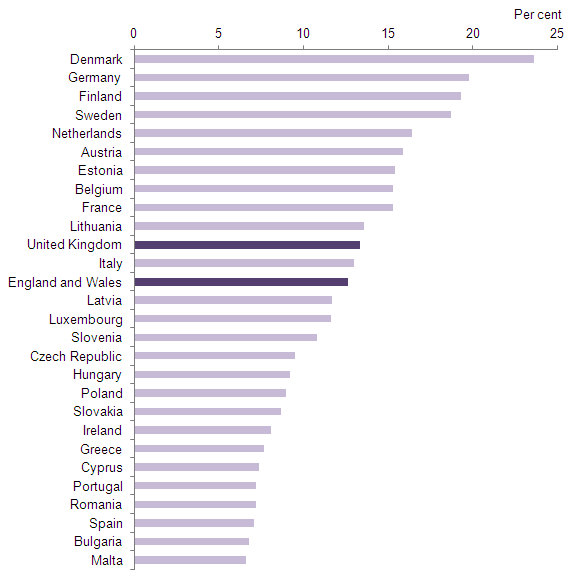 proportionally this has remained unchanged since 2001 although the number of people living alone has increased by 0.6 million.
The composition of singlehood shows 2.5million between 45 and 64 living in their own home alone with the number of men on living on their own has increased far more than women.
Comparisons with other EU countries show that while 13% of the total resident population of England and Wales (7.1 million) were living alone in 2011, Denmark had the highest proportion with 24% of its total resident population living alone.
This Office for National Statistics interactive map shows the distribution of one-person households (singlehood) across England and Wales from 2011 Census data.
Although the number of people living along in the UK is relatively smaller than other EU countries the expectation for what Eric Kinenberg terms solo living, is to continue growing. So what is driving this growth? American sociologist Eric Kinenberg research identified the following points:
- more people live alone than ever before is that they can afford to
- the rise stems from the cultural change that Émile Durkheim, called the cult of the individual – according to Durkheim, this cult grew
 out of the transition from traditional rural communities to modern industrial cities.
 - divorce once justified a person’s decision to stay in an empty-shell marriage -today if someone is not fulfilled by their marriage, they have to justify staying in it, because there is cultural pressure to be good to one’s self.
- as divorced or separated people often say, there’s nothing lonelier than living with the wrong person- there’s a difference between being lonely and alone
- communications revolution has allowed people to experience the pleasures of social life even when they’re living alone
- young solitaires actively reframe living alone as a mark of distinction and success -they use it as a way to invest time in their personal and professional growth building up a strong network of friends and work contacts.
- contemporary families are fragile, as are most jobs, and in the end each of us must be able to depend on ourselves.


In contrast other social groups identify the following problems with the growth in singlehood:
- number of people living alone has pushed up demand for housing
- is very expensive in terms of state benefits and health and social services care
- people who live alone are more likely to need the NHS or social services.
This website holds more information on absolute and relative poverty.
Absolute poverty refers to a set standard which is the same in all countries and which does not change over time. An income-related example would be living on less than $X per day.
Relative poverty refers to a standard which is defined in terms of the society in which an individual lives and which therefore differs between countries and over time. An income-related example would be living on less than X% of average UK income.
Absolute poverty and relative poverty are both valid concepts. The concept of absolute poverty is that there are minimum standards below which no one anywhere in the world should ever fall. The concept of relative poverty is that, in a rich country such as the UK, there are higher minimum standards below which no one should fall, and that these standards should rise if and as the country becomes richer.
Absolute poverty
Clearly, where both absolute and relative poverty are prevalent, it is absolute poverty which is (by far) the more serious issue. This is the case in much of the third world, where the focus is therefore on fixed income thresholds (typically $1 or $2 a day, on the grounds that this is the minimum needed for mere survival). But in a UK setting, such thresholds have no import: no one in the UK lives on incomes anywhere near this low.
So, logically, either one concludes that there is no absolute poverty in the UK or that a much higher threshold of absolute poverty than $1 or $2 per day should be used.
The view that there is no absolute poverty in the UK is a perfectly valid position to take.
The view that there should be an absolute poverty threshold but that it should be much higher than $1 or $2 per day begs the question about how such a threshold should be defined and on what basis.
- In the UK, the main efforts to define such thresholds have been undertaken under the general heading of ‘minimum income standards’, which basically estimate the level of income required to purchase a given basket of goods and services. But the key point about such initiatives is that the basket of goods and services is defined according to the norms of the day and, as such, are inherently relative rather than absolute in nature. So, for example, there would be many items in the ‘today’s basket’ that would not have been in the basket 50 years ago. In other words, ‘minimum income standards’ relate to relative poverty rather than to absolute poverty.
- In recent years, the Government has begun to describe households with less than half 1 the average 1997 household income (after adjusting for inflation) as being in ‘absolute poverty’. This is, however, purely a political device – the only relevance of 1997 is that it is when the current Government came into power. 2 That is not to say that the statistic is unimportant, simply that it should not be described as ‘absolute poverty’.
To summarise: there is no obvious way of defining an absolute poverty threshold except the $1 or $2 a day thresholds defined on the grounds that this is the minimum needed for mere survival. But in a UK setting, such thresholds have no import: no one in the UK lives on incomes anywhere near this low.
Relative poverty
The view that relative poverty is not important is a perfectly valid position to take – it is just not the view that the authors of this website, along with most other researchers, the EU, the UK government, and politicians of all hues across the political spectrum take. So, for example, the government’s target of halving child poverty by 2010 is defined in terms of relative poverty.
The reason that we believe that relative poverty is important is because we believe that no one should live with “resources that are so seriously below those commanded by the average individual or family that they are, in effect, excluded from ordinary living patterns, customs and activities.” 3 In other words, we believe that, in a rich country such as the UK, there should be certain minimum standards below which no one should fall. 4 And, as society becomes richer, so norms change and the levels of income and resources that are considered to be adequate rises. Unless the poorest can keep up with growth in average incomes, they will progressively become more excluded from the opportunities that the rest of society enjoys. If substantial numbers of people do fall below such minimum standards then, not only are they excluded from ordinary living patterns, but it demeans the rest of us and reduces overall social cohesion in our society. It is also needless.
If one accepts that relative poverty is important in principle, then the obvious issue arises of what thresholds to use and on what basis. This is discussed in detail on the page on choices of low-income threshold. Our basic answer is that it does not matter, so long as the thresholds are defined in relation to contemporary average (median) income and are for households rather than individuals. It is for this reason that the main indicators on this website use a variety of thresholds, so that a fuller picture of trends can be developed. But, for reasons of consistency and clarity, there has to be a ‘headline’ threshold and, for this, we use the same threshold as both the UK government and the EU, namely a household income of less than 60% of contemporary median household income.
Some people criticise the concept of relative poverty on the grounds that it is to do with ‘inequality’ rather than ‘poverty’. At one level, this is simply an issue of semantics – because of the potential confusion between ‘absolute poverty in the third world’ and ‘relative poverty in the UK’, we are also not very comfortable with the phrase ‘relative poverty’ and this is why we use the more descriptive ‘in low-income households’ throughout this website.
But at another level, the criticism is simply confused: whilst ‘inequality’ is about differences in income across the whole of the income distribution, ‘relative poverty’ is about the number of people who have incomes a long way below those of people in the middle of the income distribution. These two things are very different. For example, whilst there will inevitably always be inequality, there is no logical or arithmetic reason why there should always be people in relative poverty.
To summarise: whether one believes that relative poverty is important or not is a matter of opinion, but all political parties in the UK believe that it is important and so do we. There are well-established ways of measuring the extent of relative poverty and it is these methods to which this website adheres.
Women interviewed by Ann Oakley (“The Sociology of Housework”, 1974):
-
“To an extent you’re your own master…you can decide what you want to do and when you want to do it…it’s not like being at work when somebody rings you up and you’ve got to go down and see them or you’ve got to do this and that within half an hour.”. (Ex-computer programmer)
-
“The thing that’s nice about being a housewife is you have your own time -there’s nobody behind you with a punch card. You’re your own boss, like…” (Painter and decorator’s wife)
Oakley’s research findings:
- the major finding here is that dissatisfaction with housework predominates with 70% of the women interviewed came out as ‘dissatisfied’
- monotony is a common experience. Three quarters of the sample report it, and 80% of these are dissatisfied with housework
- loneliness is a frequent complaint. Most of the women who are dissatisfied with housework report a low level of social interaction with others.
- autonomy is the most highly valued dimension of the housewife role. ’Being one’s own boss’ – a phrase used by nearly half the sample
- housework is the most disliked aspect of ‘being a housewife’
- housewives have a long working week. The average in this sample is 77 hours
- experiences connected with women’s performance of jobs outside the home have some bearing on their satisfaction with work in the home. All the women who held high status jobs in the past are dissatisfied
Oakley herself points out: “Housewife’s autonomy [personal freedom] is more theoretical than real. Being ‘your own boss’ imposes the obligation to see that the housework gets done. The responsibility for housework is the wife’s alone and the failure to do it may have serious consequences…the wrath of husbands and the ill-health of children.”.
From the above findings there’s a strong relationship between power and housework. Though respondents (those being interviewed) have a degree of autonomy (power) within the home this power is only over the daily routine (what Stephen Lukes’ terms as 1st face of power), whereas real power (Stephen Lukes’ third or radical face of power) resides with the male.
Female domestic labour:
-
On average, full-time housewives worked 60 per week on household chores.
-
When children were involved, an extra 10 hours a week was added to domestic labour
Male domestic labour:
-
Males devoted on average 11 hours per week on household chores.
-
When young children involved, males devoted 5 hours per week to childcare.
-
These 5 hours per week were not added to the males’ total hours, but subtracted from their “normal” household duties (Men, on average, gave the same amount of time to domestic labour, regardless of the extra work involved in raising children).
Below you can read about the numerous sociologists who have looked at the complex dynamics of between couples in the family.
How have relationships changed? Bott, 1957. Original text Elizabeth Bott ‘Family and Social Network’
Elizabeth Bott’s Family and Social Network describes two contrasting types of conjugal roles: segregated and joint. Segregated roles involve a clear differentiation between the tasks undertaken by men and women, with each pursuing clearly defined and distinct activities. A joint relationship, on the other hand, is one where the differentiation – or ‘division of labour’ – is much less clear, and tasks, interests and activities are shared to a much greater degree. What Bott’s study claimed is that if family members maintain ties with a network of friends or neighbours who know one another, the members of these external social networks can develop norm consensus and exert pressure on the network’s members to conform.
Are conjugal roles now less segregated? Wilmott & Young, 1973.
Wilmott and Young’s The Symmetrical Family detects a shift in conjugal roles which they see as reflecting a new type of relationship between husband and wife. They detect a movement away from traditional segregated roles towards more joint forms of relationship. The trend originated with middle class families, but increasingly, they contend, working class families have adopted the same arrangement.
Who takes care of the housework? Oakley, 1974.
Ann Oakley’s The Sociology of Housework underlines the persisting inequalities in family life. It was the first influential study to consider housework as ‘domestic labour’ – i.e. as another form of work. Her respondents depict their domestic obligations as repetitive, unfulfilling and under-appreciated. She found little to support the notion that roles in the family were becoming more ‘symmetrical’, with power more equally shared between couples. Her conclusion is that ‘housework is work directly opposed to the possibility of human self-actualisation.’
Is the husband pulling his weight? Hartmann, 1981.
Heidi Hartmann’s research found that women who had jobs outside the home nevertheless remained responsible for the bulk of the housework. Husbands with working wives did not tend to do any more housework than those whose wives did not. She concedes that the growth of female participation in the labour market has conferred on women some degree of independence. However, the low waged work typically available to them reinforces male dominance both in the home and in the wider society – findings summary
What happens when men don’t work? McKee & Bell, 1986.
Linda McKee and Colin Bell explored the effects of male unemployment on families. They found a strong resistance on the part of many of their respondents – both male and female – to the notion of a woman as the main ‘breadwinner’. The men in the study did not feel obliged to undertake housework to any appreciable degree. In fact, this was an attitude that the women themselves reinforced, for fear that their husband’s ‘masculine identity’ – already undermined by the stigma of unemployment – would be further challenged by enhanced domestic responsibilities.
Who does the emotional work? Duncombe & Marsden, 1995.
Duncombe and Marsden’s research reinforces earlier studies that revealed inequalities in power and domestic responsibilities. They add to this the finding that women believe they make the primary ‘emotional investment’ in the family and marriage. Many of their female respondents complained that their husbands were indifferent to their role in holding the relationship together. The upshot of this, according to the authors, is that women are frequently saddled with a ‘triple shift’ of obligations: outside work, housework – and emotional work.
Edgell
Within the family it is important to distinguish between major and minor decisions. When the actual decisions were looked at in detail what Edgell 1980 discovered was only about half of the family decisions were taken jointly. The husband dominated the more important decisions like moving house, family finances, and buying a car.
The more frequent and less ‘important’ decisions were left to the wife. These decisions tended to be about interior decorating, food management, and children’s clothes. This difference between the power to make major or minor decisions indicates that power is more complicated than just winning the discussion as some groups/individuals can set the agenda relegating an issue from a major to minor one.
