
One form of family diversity which moves away from traditional notions of the family is the step-family now more commonly known as the reconstituted or blended family.
Allan & Crow (2001) research found ‘seven out of ten families with dependent children may be described as married-couple families these do not all conform to the stereotype of the ‘normal’ family as some are step-families or reconstituted families. Step-families with dependent children account for 7% of all families and there is evidence of an increase in the proportion of step-families in recent years’ (p289).
 Carol Smart, co-author of The Changing Experience of Childhood, has conducted research with many children whose families have broken up. In half the cases, at least one parent had found another partner. ‘It didn’t mean the adults always got on terribly well, but where it worked, the children felt they had two homes.’ But these homes were subtly different from the ones that had preceded them (and not only because they
  were, one hopes, happier).
‘Where there was still frequent contact with the biological parent,’ Smart found, ‘it was impossible for the step-parent to become a substitute mother or father. They tended to assume instead a non-authoritarian, non-disciplinarian, companionship role. A new etiquette is emerging.
Dorit Braun of Parentline Plus says that blended families often take 10 years to bed down completely. But it’s certainly true that the step role – sometimes a sort of uncle, father, big brother – is shifting and uncertain. And discipline is the most fraught and visible example of the unease.
As one of the people I interviewed said, ‘It’s all tied up with will they like you or not?’ The advice (for what it’s worth, when children are being really infuriating) is to let the biological parent do the disciplining and, if she’s not there, to say, ‘I don’t think your mother would like you to do that.’
Bedell 2002 also found there are plenty of other difficulties that intact families don’t have. How do you handle birthdays? What do you all do at Christmas? When there are competing rituals – stockings or pillowcases – whose do you jettison?
How is everyone going to react when there’s a new baby who really is a child of this family? It may look like a good idea to the adults for children to split their time 50-50, but should children really be spending their evenings shuttling between homes in cars, ending up miles away from their friends?
And then there are the different values. One house is inevitably stricter than the other. There are different rules about bedtimes, homework, eating meals together. And it’s tedious, especially if your house happens to be the stricter one – although by the time your children get to be teenagers, there may be benefits to their having seen that there’s more than one way of doing things.
Peter Eldrid of Parentline Plus cautions that, ‘It’s important not to assume that every difficulty you face is to do with being a stepfamily. All families have upheavals.’
Fact file on blended/reconstituted family’s
- 10% of all British children lives with one birth parent and a step parent
- Over 50% of children who live in two different households take a positive view of their ‘divided lives’
- 6% of all families with children are step families
- Two fifths of all marriages are re-marriages
- 25% of children have experienced their parents’ divorce. Over 50% of them will find themselves members of a stepfamily when their mothers and fathers go on to find new partners.
The above extract came from an Observer article by Geraldine Bedell (2002)
‘One-parent families’ only appeared in official documentation in the 1960s. Of course, arrangements whereby one parent brings up a child have always existed but historically it was a phenomenon known by different stigmatised names (e.g. ‘unmarried mother’, ‘fatherless family’) and regarded from different perspectives (e.g. as pathological).
The change in name, some shift towards being regarded as a variant family form, the rise of pressure groups, changes in welfare provision and the collection of statistics on what is now more commonly referred to as lone parenthood all illustrate how this category and this experience is socially constructed.
Due to this social-shift an official definition of a lone-parent family exists to offset any social stigma: “A mother or father living without a partner (either married or cohabiting), with their dependent children. The child must be under 19 and in full-time education.”
However, the experience of lone parenthood remains ‘full of ambiguities’ with an overall picture of ‘resilience and inventiveness as well as unrelieved responsibilities and frustrations in the face of adverse economic and social processes of marginalisation’ (Hardey and Crow, 1991:3). For example single parent households are the most likely to be in arrears on one or more household bills, mortgage or nonmortgage borrowing commitment 31% (Gingerbread, 2013).
Nevertheless the following official statistics (January 2012, Office for National Statistics) show the extent to which Britain’s seen an increasing rise in the number of single-parent families:
- In 1971 just 8 per cent of families with children were single parent families
- In 1998 24 per cent of families with children were single parent families
- In 2011 26 per cent of families with children were single parent families
In June 2013 the Centre for Social Justice published a report into the extent and effects of lone parent families in the UK. The Centre for Social Justice (CSJ) was established as an independent think-tank by the Rt Hon Iain Duncan Smith MP in 2004.
As Conservative Party leader Iain Duncan Smith said: “In the fourth largest economy in the world, too many people lived in dysfunctional homes, trapped on benefits. Too many children were leaving school with no qualifications or skills to enable them to work and prosper.”
In contrast other social commentators have argued the Centre for Social Justice is a right-wing think tank with a right-wing bias. For example Tom Slater Senior Lecturer in Human Geography at the University of Edinburgh published his left-wing perspective of the Centre for Social Justice.
These different explanations are mirrored in the media with left and right-wing newspapers taking a particular stance on the issue of lone-parenting. Newspapers like the Guardian express a left-wing analysis while right-wing newspapers such as the Daily Mail express their view point. What is becomes interesting is ITV’s ‘objective’ reporting on the issues surrounding loan parenting.
The competing political explanations highlight the complexity in creating social policies. Notwithstanding these tensions lone parenting is increasing and the reasons are as complex as the explanations.
Sociologists have identified the numerous causes of lone parenthood. One method they use is to separate the different causes between married and non-married individuals.
For married couples the causes of lone parenthood tends to fall into three main categories:
- divorce
- separation
- death of a spouse
While the cause of lone parenthood for individuals who have never been married tends to be due to:
- may have been living with the parent of the child when the child was born, but then their relationship terminated
- a relationship was formed after the birth of the child, but the relationship terminated a period of time later
The reasons for the increase in lone-parenthood are varied. Allan and Crow (2001) have identified two factors. First is an increase in marital breakdown and secondly a rise in births to unmarried mothers. They argue these trends are due to society’s acceptance of family diversity. While David Morgan (1994) puts the rise of lone parenthood down to the changing relationships between men and women a point also identified by Val Gillies (2003) who explored the changing family relationships which stresses the changing dynamics of family intimacy through changing ‘ethics of friendship, negotiation and disclosure’ which adds to family diversity.
Mark Brown (1995) puts the increase of singlehood down to a decline in ‘shotgun weddings’ in addition to a growing social acceptance of cohabitation. And if that relationship fails, then singlehood becomes the outcome. The increased acceptance of having children outside marriage was also uncovered from Alison Park’s (2001) research and in 2004
Who are the single parents?
- There are 3 million children living in a single parent household (23% per cent of all dependent children) (1)
- Around 8 per cent of single parents (186,000) are fathers (2)
- The average duration of single parenthood is around 5 years (3)
- Only 6.5 per cent of all births are registered alone, and 10 per cent are registered to two parents who live apart (4)
- Single fathers are more likely to be widowed than single mothers (12 per cent of single fathers are widowed, compared with 5 per cent of single mothers), and their children tend to be older (5)
- Just under half of couples divorcing in 2009 had at least one child aged under 16. Over a fifth (21 per cent) of the children in 2009 were under five and 63 per cent were under eleven (6)
Despite the increase of single-parent families their is little evidence to suggest single parents actively seek such status by having planned pregnancies without a partner. However some politicians argue the rise of single parenthood is due to the welfare state.
(Sources: (1)Households Below Average Income, An analysis of the income distribution 1994/95 – 2009/10, Table 4.1ts. Department for Work and Pensions, 2011; (2) Lone parents with dependent children, January 2012, Office for National Statistics; (3) Leaving Lone Parenthood: Analysis of the repartnering patterns of lone mothers in the U.K. Skew, A., Berrington, A., Falkingham, J. 2008, on data from 2005; (4) Derived from Households and Families, Social Trends 41, Table 6 & 7. ONS, 2011. Data from 2009 (5) Analysis of Labour Force Survey data from June 2006 produced for Gingerbread by ONS; (6) Divorces in England and Wales 2009. ONS Statistical Bulletin, February 2011

Though it is argued ideology promotes the nuclear family as being the dominant family form the reality is somewhat different. Familiy structures come in many diverse forms. Watch the following clip and identify as many diverse family structures as you can.
We also have evidence from the data below:

The above data from Social Trends shows the changes within family forms and the extent of familial diversity.
What trends can we uncover from the above data on household trends?
We can see there’s been a marked decrease in nuclear families but an increase in lone-parent families. Moreover the data relies heavily on terms ‘nuclear and couple’ when describing families. This has the effect of ignoring couples who are:
- Remarried
- Cohabiting
- Same sex
- How do the above three groups affect the ideology of the family?
Next lesson
 We have found the Leach argues the cereal packet family is an ideology because it creates a distorted image of what the family should be. It is seen as ideological because it creates a powerful image which is replicated over and over to the extent it becomes normal and everything else is compared against this ideal.
Therefore the nuclear family headed by a married heterosexual couple and not a gay couple is the ideal family unit for raising children in!!!
- But is such a view point a product of ideology?
- Using your understanding of the relationship between ideology and the family, explain the relationship between ideology, the family, socialisation and stratification and how they might create an ideology?
Sociologists argue that this ideology creates a distorted picture because people are socialised in a primary way by their family to recognise the nuclear family as ideal as well as through the media (secondary socialisation). This creates a dominant ideology of the nuclear family as ideal. As a consequence of this stereotypical image other family forms are stratified beneath the nuclear family and familial diversity remains hidden to the extent anything different from a nuclear family is second best.
Next lesson
Last lesson we looked at the impact of divorce on children and the differences between New Right and feminist ideas on divorce.
The New Right model sees the family as the traditional nuclear family unit.
- What are the key points of a traditional family?
How true is this image of the traditional family? In her book ‘Changing Britain’ Susan McRae (1999) says ‘Britain today is a much more complex society than in past times with greater diversity in the types of households within which people live’
- Identify as much family diversity as you can
- Identify which perspective might favour diversity and which might be anti-diversity?
- Identify as many places in which the traditional family is represented as being ideal?
Where you have an ideal being reproduced over and over it becomes seen as normal and is then idealised as the best example of something. There is a more elaborate term to describe something which is seen as the best of something and it is known as ideology.
An ideology is something in which a significant number of people agree about something.
A very good example is evident in this clip
- What ideologies are evident in the clips?
- Try and identify five areas of life which might be seen as ideological, and explain why they are ideologies.
Next lesson – cereal packet
What are the effects of divorce on children?
Rodgers and Pryor (1998) study ‘Divorce and Separation’ reviewed 200 studies attempting to find out if divorce had a negative effect on children. Children of separated families have a higher probability of:
- being in poverty and poor housing;
- being poorer when they are adults;
- behavioural problems;
- performing less well in school;
- leaving school/home when young;
- becoming sexually active, pregnant, or a parent at an early age;
- depressive symptoms, high levels of smoking and drinking, and drug use during adolescence and adulthood.
Rodgers and Pryor suggested divorce alone did not cause the above problems but occurred in association with other factors which affected the outcomes when divorce occurs.
Factors affecting outcomes:
- financial hardship can limit educational achievement;
- family conflict before, during and after separation can contribute to behavioural problems;
- parental ability to recover from distress of separation affects children’s ability to adjust
- multiple changes in family structure increase the probability of poor outcomes;
- quality contact with the non-resident parent can improve outcomes.
According to Rodgers and Pryor those children whose parents managed to avoid the above were largely unlikely to suffer from a divorce. The above was also found in US longitudinal research conducted by Hetherington (2002) who concluded that for 75% of children divorce has few negative effects and concluded that ‘divorce is a reasonable solution to an unhappy and acrimonious marital relationship’.
In contrast Jon Bernardes (1997) studies concluded divorce may be less damaging to children than living with parents in constant conflict.
Nevertheless, for New Right commentators like Charles Murray divorce produces a significant number of lone parent families and this is eroding the very fabric of society. See more on New Right views here
In contrast to New Right perspectives feminist balk at the idea of any restrictions to divorce laws. As it is through these laws women have found the freedom, independence and a greater social equality.
Whichever argument is seen as the stronger sociologists are interested in the way divorce and remarriage is helping to increase the trend towards family diversity and within this diversity new relationships are emerging. Many families are reconstituted/blended after divorce and as Carol Smart (2001), co-author of ‘The Changing Experience of Childhood’ found there is no ‘hand-book’ on how to be a good step-parent as “a new etiquette is still emerging.”
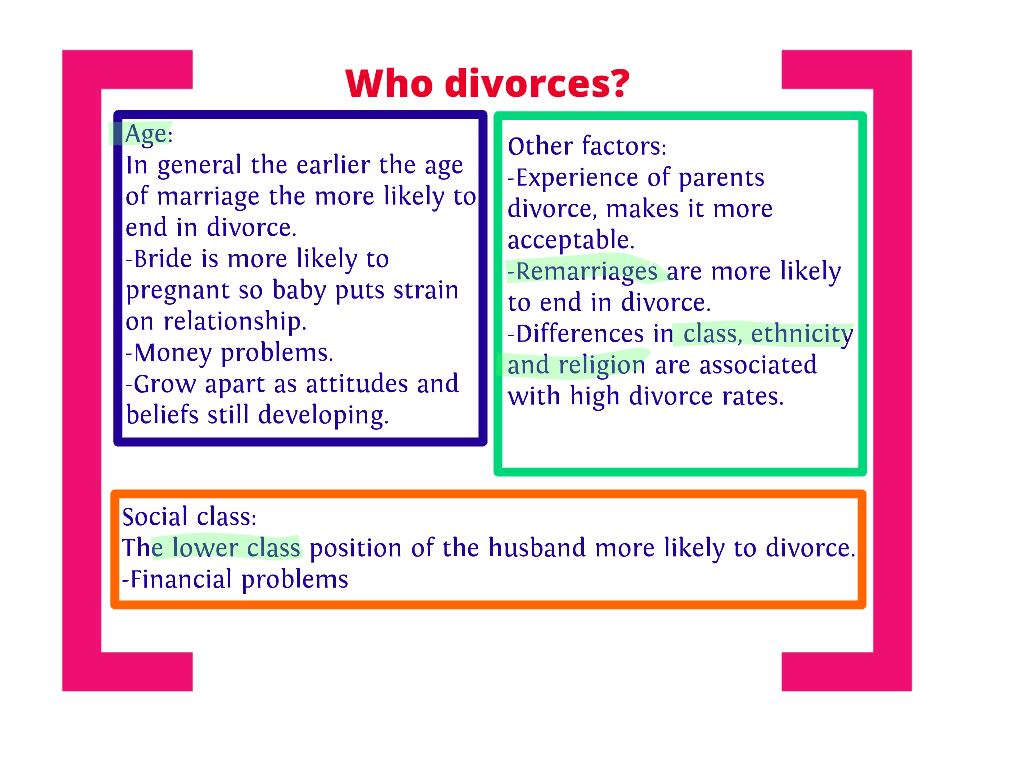
- Which group of people do you think are more susceptible to divorce? Watch the following clip before we discuss the question
- Age – The younger a person gets married the greater the risk of divorce. What reasons would you give for this?
- Younger people are more likely to have money problems. This tends to be because you’re still learning your job and so the pay is lower yet the household bills remain high
- Lack of experience in choosing a partner
- A naivety in recognising what marriage really involves
- When you’re young people are still ‘growing/developing’ into the people they become, this way it’s easier to grow apart
- Social class – the lower your social-class the more likely you are to divorce. This tends to be due to financial/employment issues
- Other factors – you’re more likely to divorce if your own parents were divorced, as this could lead to their offspring seeing divorce as acceptable. Remarriages are more likely to end in divorce as are marriages between different classes, ethnicity and religions. This could be due to the different levels of expectation.
Next lesson
The previous lessons highlighted the ‘pressure’ on marriage as an institution as more people choose to live on their own (singlehood) or to cohabit.
However divorce also adds additional pressures on marriage. But at the same time marriages it’s important to recognise marriages do ‘end’ in  other ways without any legal divorce proceedings occurring:
- Separation – where couples effectively end their marriage, but remain legally together and still live under the same roof
- Empty-shell marriage – where a couple remains legally married but love, sex and companionship are in the past
- Confluent love – reasons for highest divorce rates among couples in their 20s
Notwithstanding these ‘quiet’ annulments to marriage, divorce is the more common expression of marriage annulment which is best displayed in the following divorce data infographics.
Until the second half of the 20th century divorce was a relatively rare event. In 1901 there were 512 divorces in England and Wales. In 2001 there were 141,135 divorces while in 2013 42% of all marriages ended in divorce (ONS).
The Office for National Statistics summerised the following facts on UK divorce rates:
- 34% of marriages are expected to end in divorce by the 20th wedding anniversary.
- an additional 6% of marriages are expected to end by the 20th wedding anniversary because one of the spouses has died
- therefore 60% of marriages are expected to survive to the 20th anniversary
- 16% of marriages reach the 60th wedding anniversary
- the average marriage is expected to last for 32 years
The dynamics within these divorce figures have been analysed to examine the proportion of marriages ending in divorce as well as the age differences on marriage and divorce.
The reasons for the increasing trend towards divorce is varied, however the following reasons provide a broad overview:
- Law – until relatively recently obtaining a divorce was exclusive to rich men and it wasn’t until legal aid was introduced in 1949 that divorce was available to the less well-off. But it wasn’t until the 1969 Divorce Reform
Act that the removal of guilt was removed from legal proceedings and the concept of the ‘irretrievable breakdown of marriage’ was introduced. When this act came into power in 1971 divorce rates soared even though applicants had to wait 3 years before they could petition for divorce. This was finally reduced to 1 year in The Matrimonial Family Proceedings Act of 1984 - Economics – economic growth meant more people were needed to enter the labour market and therefore women were increasingly able to find positions of employment in a variety of occupations. This changing role of women was aided by Equal Opportunities legislation in the 1970s women were remunerated better. This meant women were able to file for divorce in the knowledge they could support themselves. Something they wouldn’t have been able to do in the past
- Changing perceptions of love – Fletcher argues that the reason for increasing divorce rates is due to people valuing marriage even more and are seeking an ideal marriage. There could be some truth in this as the institution of marriage hasn’t been rejected. Giddens’ developed Fletcher’s theme with his concept of ‘confluent love’
 Changing social values – divorce has increasingly become socially acceptable. As the stigma of divorce has diminished, couples are less likely to remain together in order to keep up appearances. In effect divorce has moved from being abnormal to something normal
- New economic status for women -an expanding economy (see above) resulted in more women entering the labour market and have relatively received better pay and conditions. All this is now included in divorce settlements which has left women very well-off. Though it is worth noting only the very well off tend to benefit from such settlements, working-class women tend to be financially worse off after divorce settlements
- Individualisation – According to Ulrich Beck, contemporary society values individual freedom to the extent social norms are placed second to the needs of individual fulfilment. What this means is a higher value is placed on individual expression, self-fulfilment and independence. How might people express this after several years of marriage? http://news.bbc.co.uk/1/hi/uk/4198951.stm
- Feminism – many people argue the feminist movement encouraged much of the above points. The 1960/70s feminist movement did pave
 the way for equal opportunities at work, in education, in rights etc. What is interesting though is how more women petition for divorce then men. Many feminists say it’s marriage itself which is at fault. Traditional marriage encourages patriarchy – male dominance, unequal division of labour with women being largely responsible for the housework, childcare even when working full-time!
 - The real consequences of divorce are evident in this article

Cohabitation and marriage
New figures from the UK Census have revealed that more and more couples are living together without being married and/or before getting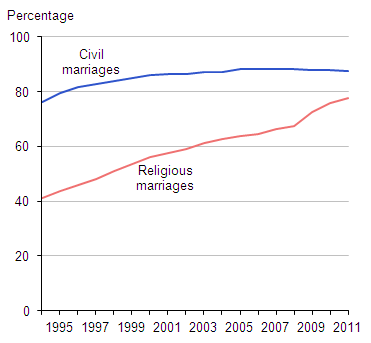 married.
In 1994, the earliest date for which figures are available, 75% of couples marrying in a civil ceremony lived together before getting married. This percentage increased steadily to 88% in 2011 with the number of opposite sex cohabiting couple families has increased significantly, from 2.2 million in 2003 to 2.9 million in 2013 (ONS).
A lower percentage of couples having a religious marriage cohabited before marrying for all years. However the gap has narrowed over time. In 1994, 41% of couples having a religious ceremony lived together before marriage, almost doubling to 78% in 2011.
Other statistics show that the number of couples cohabiting in the UK has doubled since 1996, illustrating that cohabitation is now more common, both as a precursor and an alternative to marriage.
With cohabitation having grown significantly in popularity over the past 40 years Eleanor Macklin (1975) identified four types of cohabitation:
- temporary casual for convenience
- affectionate dating
- trial marriage
- temporary alternative to marriage
- permanent alternative to marriage
Cohabitation and households
The recent data, published by the Office for National Statistics, shows that households containing one cohabiting couple have risen by 500,000 in ten years from 1.8 million in 2001, to 2.3 million in 2011 – a rise of nearly 30%.
Cohabitation and dependent children
The number of dependent children living in these opposite sex cohabiting couple families also increased, The number of dependent children living in opposite sex cohabiting couple families rose from 1.4 million to 1.9 million over the same period (ONS).
The reasons for the decline in marriage and growing incidence of cohabitation are extensive:
- sexual relations – cohabiting is no longer associated with living in sin (social stigma) making cohabitation socially acceptable
- choice – people (particularly young couples) choose to cohabit in order to ‘test’ their relationship
- changing roles of women – greater economic independence has meant women are able to choose their relationships
- effective contraception – from 1967 onwards reliable contraception was made available on the NHS. This meant it made it possible for couples to cohabit without worrying about becoming pregnant
- parental freedom – the 1960s saw a gradual relaxation in parents towards their children. The formal discipline of the past slowly eroded and so eventually parents ‘allowed’ their children to live together without being married
- education – 1960s saw a growth in Higher Education, this meant more children were given more freedom than ever before
- building societies – started lending money to unmarried couples in the late 1970s and early 1980s as the social stigma waned
- divorce – there’s increasingly less stigma associated with divorce, consequently marriage as a union between couples is not as socially strong
- increasing divorce rates makes marriage is less of an aspiration for people which has added to the currency of cohabitation
Getting married is something numerous people aspire to. It’s an event to which couples spend months arranging and small fortunes creating. The clip below epitomises the symbolism of a wedding as a public announcement of their love and devotion to each other.
However when you study the data on weddings the reality is somewhat different to the representation in the films, magazines and TV.
On this page we will look at different data relating to marriage, singlehood, cohabitation and divorce. But before we look at the data in detail, we can look at some general data on marriage and divorce on the following link statistics
Task – research the data provided by the links below and compile a report, which must include the data and which answers the three questions below.

Data on marriage;
Data being single;
Data on cohabitation; (choice of data)
Data on divorce (choice of data)
- From the above data what trends can we uncover?
- Why has there been a decline in marriage and an increase in divorce?
- Why has there been an increase in being single and cohabiting?
Next lesson
