
Distribution of Wealth and Income
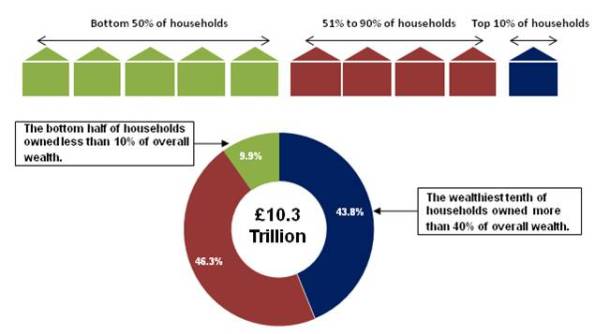
- The Office for National Statistics (ONS), illustration below shows how the wealth held by the top 10% of households is over 4 times greater than the wealth of the bottom half of all households combined (Office for National Statistics 03 December 2012)
- and, over 850 times greater than that of the least wealthy 10% of households
- the ONS report also found belonging to the wealthiest 10% of household’s required total wealth greater than £967,000
The above shows how even though home ownership in the UK has increased significantly the ownership of wealth remains concentrated in the hands of a small number of individuals and families.
- For most people the amount of money they have at their disposal comes from their income (disposable income is the amount of money a household has to spend and save after paying their taxes).
- The amount of income a person generates is largely dependent on their job but it can also come from welfare benefits or interest from savings. Income that cannot be bought and sold, such as salaries and pensions is known as non-marketable wealth.

Leave a comment